- Online Accounting Tutor
- January 8, 2024
An example of Income Statement Analysis
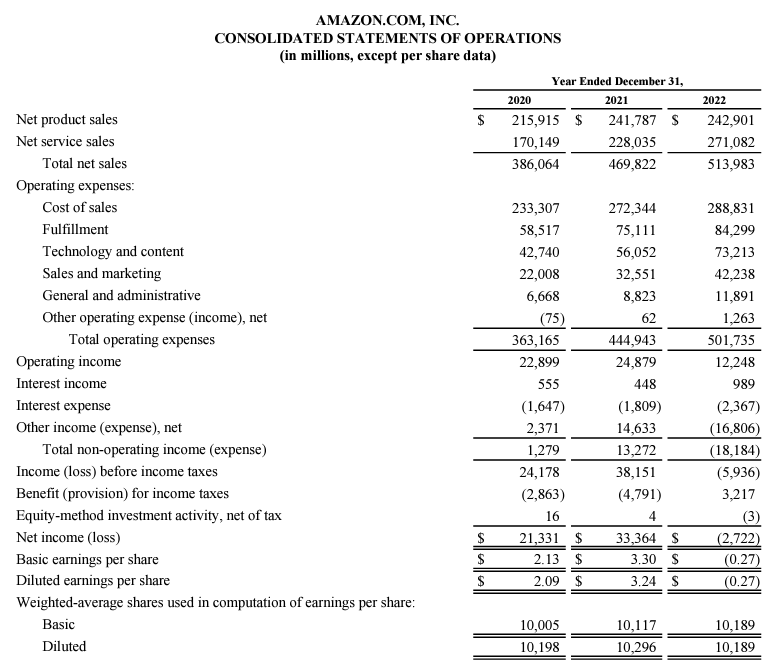
Our income statement analysis example for Amazon provides a snapshot of the company’s financial journey from 2020 to 2022. By breaking down sales, expenses, and profits, we highlight Amazon’s shift in financial health. This example serves as a clear, easy-to-understand overview of how and why Amazon’s income statement reflects a transition from profit to loss in the past year. In a previous guide, we covered how to read an income statement, and this may be a useful resource before looking at income statement analysis.
Here is the income statement example we will be using for this article;

Horizontal Analysis (Growth Rates)
We will calculate the growth rates for total net sales and net income from 2020 to 2022.
Total Net Sales Growth Rate:


Net Income Growth Rate:


Here are the growth rates for Amazon’s total net sales and net income over the past two years:
| Year | Net Sales Growth Rate (%) | Net Income Growth Rate (%) |
|---|---|---|
| 2020-2021 | 21.70% | 56.41% |
| 2021-2022 | 9.40% | -102.16% |
From this, we observe that while net sales continued to grow, the growth rate slowed from 21.70% to 9.40%. More strikingly, net income growth rate plummeted from 56.41% growth to a significant decline, as indicated by the negative growth rate of -102.16%, representing a shift from a profitable 2021 to a net loss in 2022.
Now, let’s move to the vertical analysis to understand the cost structure and profitability margins.
Vertical Analysis (Selected Items as % of Net Sales)
We’ll calculate the cost of sales, operating expenses, and net income as a percentage of total net sales for the year 2022.


The vertical analysis for Amazon in the year 2022 yields the following percentages relative to net sales:
| Item | 2022 % of Net Sales |
|---|---|
| Cost of Sales | 56.19% |
| Operating Expenses | 97.62% |
| Net Income | -0.14% |
This analysis shows that in 2022, the cost of sales accounted for 56.19% of net sales, and the operating expenses were very high, at 97.62% of net sales, leaving a negative net income margin of -0.14%. The high percentage of operating expenses relative to net sales is a significant factor in the net loss reported for the year.
Lastly, let’s calculate the profitability margins based on net sales.
Profitability Margin Analysis
We will calculate the gross, operating, and net profit margins for the year 2022 using the following formulas:


The profitability margin analysis for Amazon in 2022 is summarized as follows:
| Profitability Margin | 2022 % |
|---|---|
| Gross Margin | 43.81% |
| Operating Margin | 2.38% |
| Net Margin | -0.14% |
In 2022, Amazon had a gross margin of 43.81%, which suggests that after deducting the cost of sales, they retained 43.81 cents per dollar of net sales. However, after accounting for operating expenses, the operating margin drastically dropped to 2.38%. The net margin turned negative at -0.14%, indicating a loss, which is consistent with the net loss reported for the year.
These margins reflect the financial challenges Amazon faced in 2022, with operating expenses consuming a significant portion of the net sales, leading to an overall net loss despite maintaining a healthy gross margin. Learn more metrics you can measure when doing an income statement analysis.
"Are you tired of struggling in accounting class? Let us make accounting easy and enjoyable for you."


